
Before an AI dashboard, agree on what the numbers mean.
Reliable AI reporting begins with metric ownership, agreed definitions, traceable data, and reconciled queries that support a real decision.
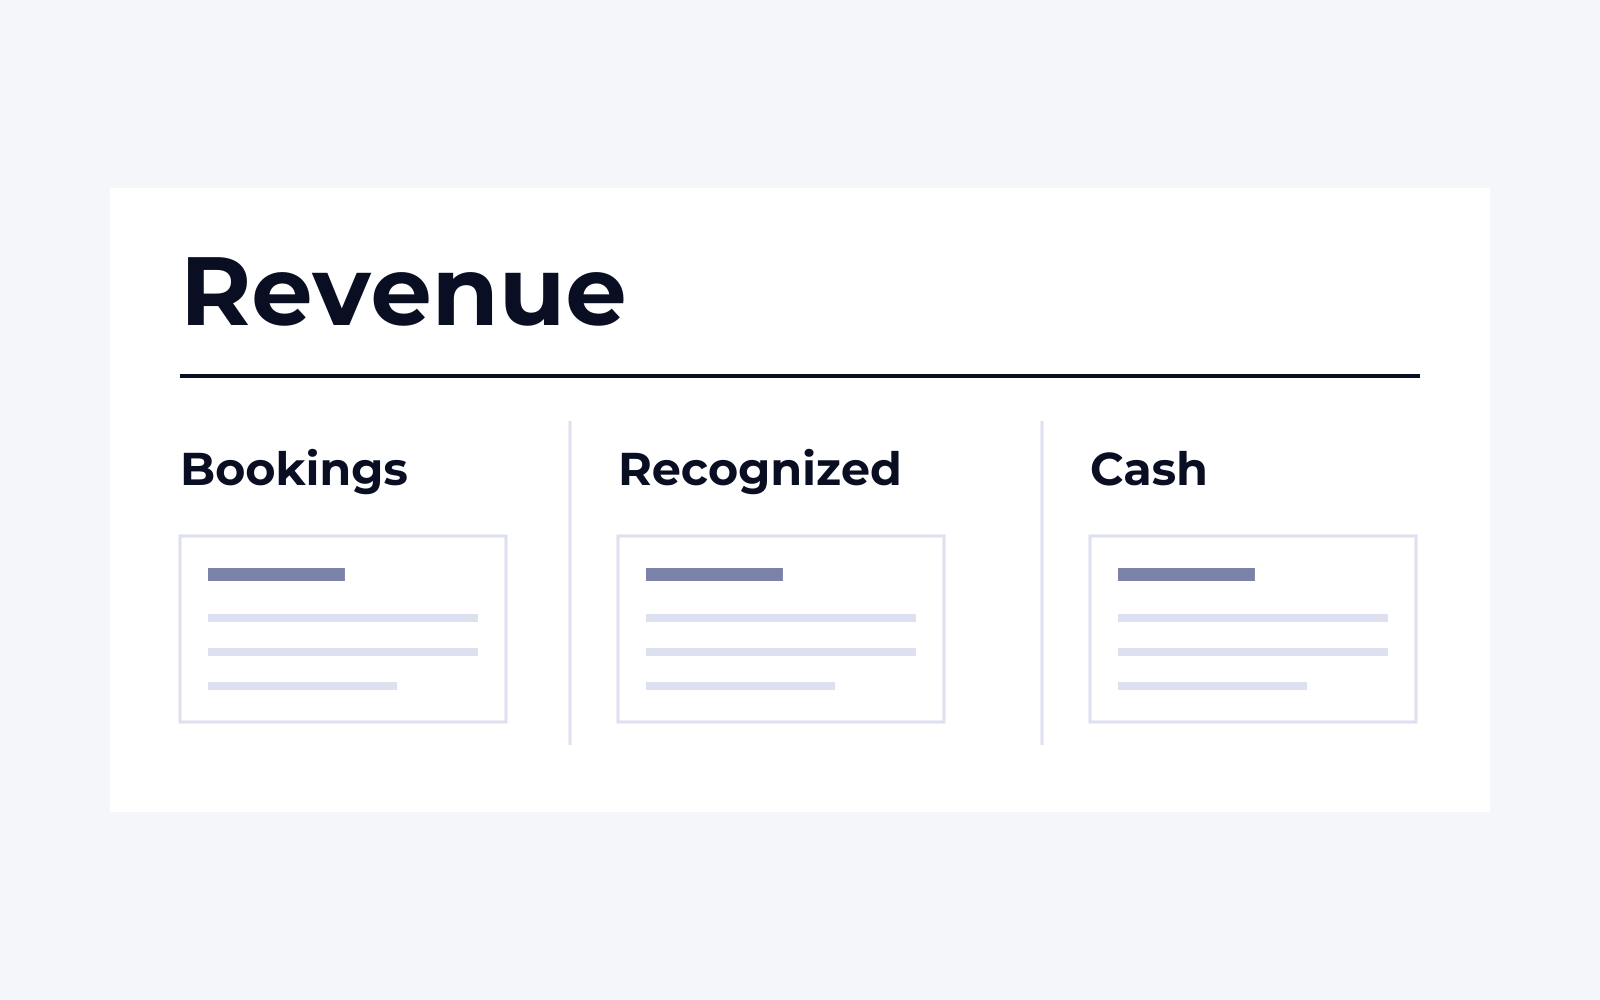
Ask an AI reporting tool for this month's revenue and it may return a precise number in seconds. The harder question is what that number represents. Bookings, invoices, recognized revenue, and cash receipts answer different questions. A conversational interface cannot settle a business definition that the organization has never agreed.
Start with the decision and its owner
Choose the decision the report should support. A delivery leader deciding whether to add capacity needs different information from a finance team closing a period. Name the person accountable for the decision, then identify the measures they use and the consequences of an incorrect answer.
For each measure, record a definition, business owner, calculation, source, reporting period, and refresh expectation. Specify treatment of exclusions, adjustments, currencies, time zones, and incomplete records where relevant. These details belong in a maintained metric definition that analysts and applications can use. An informal agreement in a meeting will not travel with the data.
Make one definition specific enough to reproduce
Consider a hypothetical service team's measure, “open cases at period end.” Its definition might state:
- Population: production customer-service cases, excluding test records and duplicate cases merged into another record.
- Calculation: count distinct case identifiers created by the cutoff whose status at that cutoff was not closed.
- Time: the final instant of the reporting month in the agreed business time zone.
- Reopened cases: count a reopened case if it was open at the cutoff, even if it had been closed earlier.
- Evidence: retain the case history or a period-end snapshot so later status changes do not rewrite the result.
The business owner must approve those choices. If the source stores only today's status, it may not support a reliable historical backlog figure. That is a data requirement to resolve before asking an assistant to explain the trend.
Resolve differences before automating them
Imagine a hypothetical services business where sales reports signed contract value while delivery reports work completed. Both teams label their chart revenue. Combining the charts in an AI dashboard makes the disagreement easier to access without making it easier to understand.
Keep the measures distinct and name them accurately. Reconcile representative periods with the responsible teams. Explain known differences through a documented bridge from one measure to another. When a definition changes, record its effective date and decide whether historical periods will be restated. A trend line that silently changes its meaning can misdirect a decision even when every calculation is technically correct.
Preserve the path from source to answer
A useful answer should expose enough context to be checked: the measure used, filters applied, period covered, and freshness of the underlying data. The reporting system should retain the source records, transformations, and query version needed to reproduce the result. That traceability is especially important when a generated explanation sounds more certain than the available data permits.
Freshness should match the decision. A daily staffing discussion may not need continuous updates. A customer availability promise may require much newer information. Define what happens when a feed is late or a reconciliation fails. Show the last successful refresh and label incomplete periods so users do not mistake a partial result for a completed one.
Constrain queries to approved meaning
Give the assistant access to curated views and approved metric definitions. Enforce permissions in the data platform, including row and field restrictions where needed. Read-only reporting should use read-only access. Validate generated queries for allowed sources, joins, filters, and resource limits before execution.
Use a set of representative business questions with reviewed answers to evaluate changes. Include ambiguous requests, missing data, and questions the system should decline. When a user asks for margin without specifying the relevant definition, the assistant should request clarification or clearly state the approved default. Plausible SQL is not evidence that the business question was answered correctly.
Prove one decision cycle
Start with one important decision and a small set of disputed measures. Agree on definitions, reconcile a completed period, and trace each answer back to its sources. Then introduce the conversational layer. Before release, pick one question a leader asks every week and require the answer to show: the metric definition, reporting period, filters, last successful refresh and reconciliation owner. If the team cannot reproduce the answer from the approved sources, the reporting layer needs more work before a conversational interface is added.
Are your reports answering the same question?
Bring two reports that disagree and the decision they are meant to support. We’ll work back through the definitions and sources.